

For marketers, a multi million-dollar battle for attention happens every year. Top brands work to push the emotional buttons of international audiences, but some ads are better than others.
Synapbox wields the power of biometrics and surveys to measure the impact of Ads.
How do we do it?
We collected and identified the emotional reactions of consumers as they watched the Super Bowl Ads, tracking the highs and lows of excitement, interest, and connection.
The use of biometric and rational measurement helps us discover the WHY behind Ad performance.


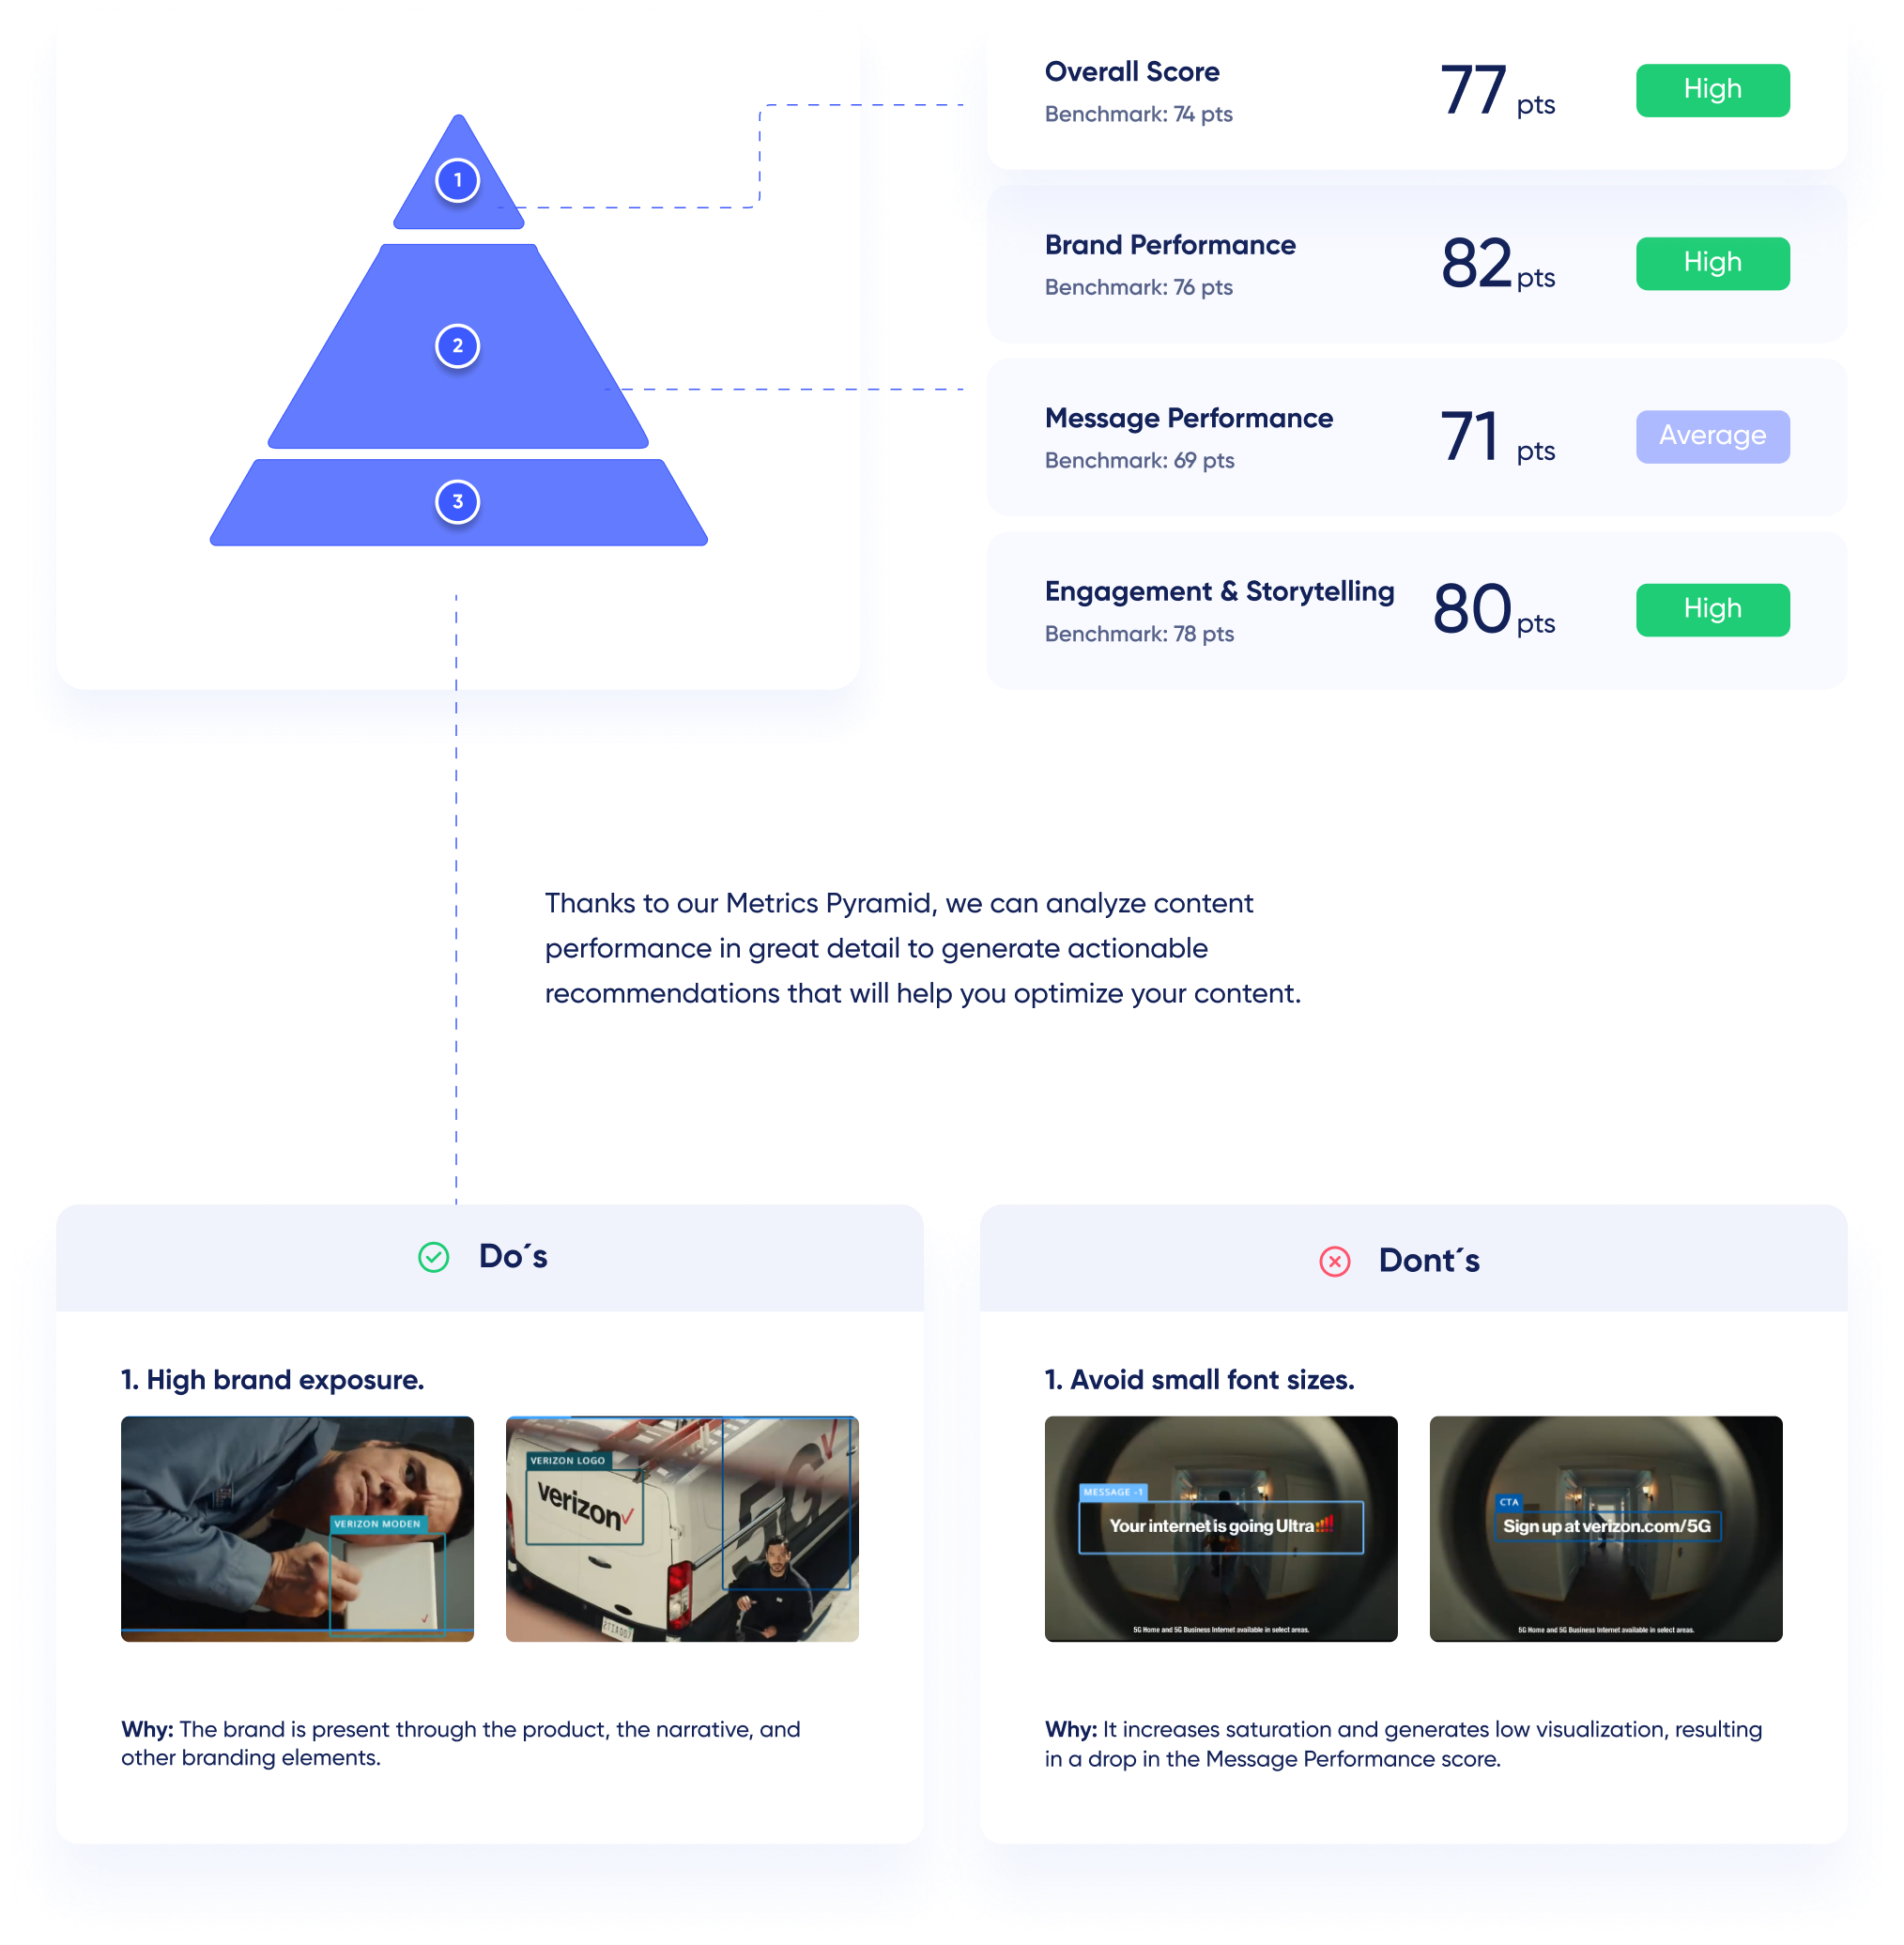
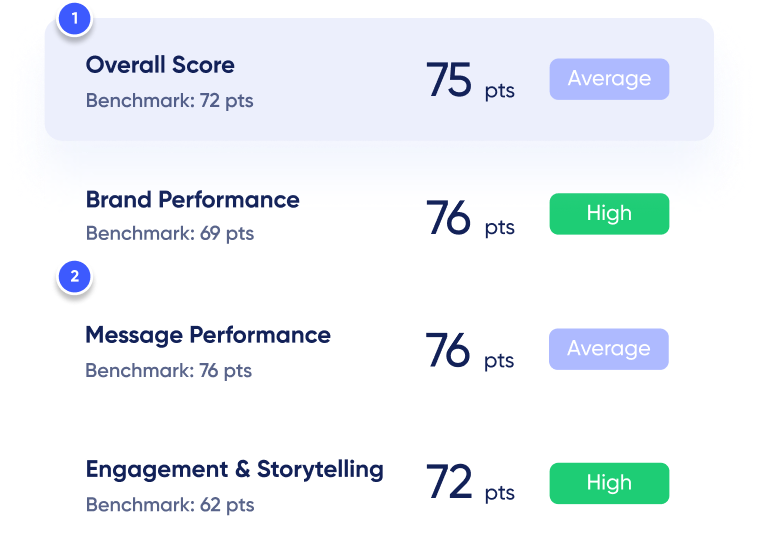
Synapbox summarizes content performance (visualized in a planogram) in biometric and rational terms to have a holistic understanding of the audience.
The green quadrant indicates a high biometric and declared performance, while the red one shows brands that perform below the average in both areas.
Here you can see how tested Super Bowl Ads performed compared to industry standards.
Verizon’s Brand Performance stood out through the overall score. The displayed brand was eye-catching, easy to associate with the content, and well-remembered. The story creates an emotional bond with the audience through humor, and the celebrity appearance positively impacted the Engagement & Storytelling indicator.


What did we learn from this year’s best (and worst) Super Bowl Ads? We partnered with WarnerMedia and QuestionPro to discuss the insights and analyze the most impactful trends we found in the different categories we tested: Cars, Beers, Retail, Services, Crypto & Financial, Tech, and Snacks.
If you missed the webinar or want to re-watch it to make the most of our learnings, here’s the video:

To dig deeper into our findings, download the general report of our SuperBowl study. Interested in a specific industry? We got you covered.
Download the most relevant information in any of the six categories we tested: Cars, Snacks, Beverages, Financial and crypto, Tech, and a super fun miscellaneous category